The E(38) boson - Understanding the Dubna measurements
By Chris Austin. 30 November 2020.
An earlier version of this post was published on another website on 3 September 2012.
As I reported in an earlier post, two weeks ago seven physicists announced the
observation of a new light boson of mass 38 MeV at the Nuclotron particle
accelerator in Dubna, near Moscow. The new boson, named the E(38), is not
predicted by the Standard Model of the strong and electroweak interactions,
and if the observation is confirmed, it will be the first discovery of an
elementary particle not predicted by the Standard Model, since the Standard
Model became established in the 1970's.
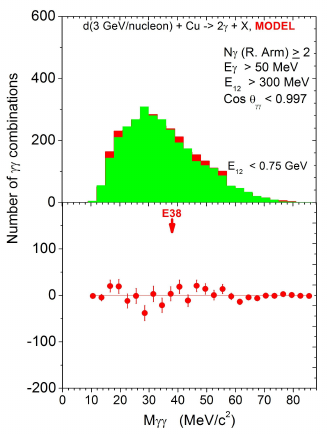
The evidence for the E(38) boson was a small excess above background, peaked
at about 38 MeV, in the distributions of the invariant mass of photon pairs
produced in three different processes, involving the scattering of beams of
deuterons or protons aimed at carbon or copper targets. For example in
Figure 2(a) of the article arXiv:1208.3829 announcing the observation of the
E(38) boson, which I am reproducing here
with permission, the green histogram
in the top panel is the Standard Model background, and the small red excess
above the background, which is largest at about 38 MeV, is attributed to pairs
of photons from the decay of the E(38) boson.
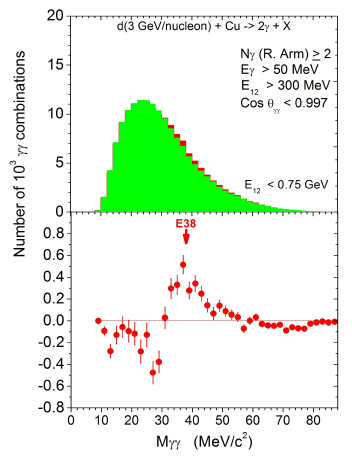 The lower panel shows the
excess after subtraction of the Standard Model background. The statistical
significance of the excess above background centred at about 38 MeV is about 5
sigma, which is the usual standard for discovery of a new particle in high
energy physics.
The lower panel shows the
excess after subtraction of the Standard Model background. The statistical
significance of the excess above background centred at about 38 MeV is about 5
sigma, which is the usual standard for discovery of a new particle in high
energy physics.
As Tommaso Dorigo has pointed out, the announcement article arXiv:1208.3829 does not
give any details of how the background distribution of the photon pair
invariant mass was determined. Since the background is about 14 times larger
than the claimed signal at the peak of the signal for the measurements shown
in Figure 2(a), and is at least 6 times larger than the claimed signal at the
peak of the signal for all the measurements shown in arXiv:1208.3829, Tommaso
is understandably sceptical about whether the signal is really there.
However the authors refer to another paper for a description of the
experimental equipment, and the details in this reference appear to address
most of the points raised by Tommaso.
To explain in more detail how the Dubna group observed a signal for the
candidate E(38) boson, and how they measured the background, it is convenient
to use units of measurement such that the speed of light  is equal to 1, so
that if, for example, distance is measured in metres, then time is measured
not in seconds but in units of
is equal to 1, so
that if, for example, distance is measured in metres, then time is measured
not in seconds but in units of
 nanosec.
Then the units of energy, momentum and mass all become the same, so that
Einstein's relation
nanosec.
Then the units of energy, momentum and mass all become the same, so that
Einstein's relation  between the total energy
  of a particle that
is not moving, and its mass
of a particle that
is not moving, and its mass  , becomes
  .
.
The total energy of a particle of mass moving at speed  can now be
written as
can now be
written as
 , which for small compared to 1,
so that the particle is moving slowly compared to the speed of light, is
approximately equal to
, which for small compared to 1,
so that the particle is moving slowly compared to the speed of light, is
approximately equal to
 , which is the sum of its rest
energy and its kinetic energy
, which is the sum of its rest
energy and its kinetic energy
 according to Newton's
mechanics. The kinetic energy of a particle that is not necessarily moving
slowly compared to the speed of light is defined to be
according to Newton's
mechanics. The kinetic energy of a particle that is not necessarily moving
slowly compared to the speed of light is defined to be
 . The sum of the total energies of all the
particles involved in a collision process is always the same before and after
the collision, even if new particles are produced or particles disappear
during the collision.
. The sum of the total energies of all the
particles involved in a collision process is always the same before and after
the collision, even if new particles are produced or particles disappear
during the collision.
If the velocity vector of a particle is
 , where
 , then its momentum vector is
 , which for small
compared to 1, is approximately
, which for small
compared to 1, is approximately
 , which is its
momentum vector according to Newton's mechanics. The sum of the momentum
vectors of all the particles involved in a collision is always the same before
and after the collision. The difference
, which is its
momentum vector according to Newton's mechanics. The sum of the momentum
vectors of all the particles involved in a collision is always the same before
and after the collision. The difference
 between the square of a particle's total
energy , and the square
between the square of a particle's total
energy , and the square
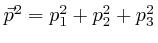 of its momentum
vector
of its momentum
vector  , is always equal to the square of its mass , for all possible
values of its speed . The speed of a massive particle is always less
than 1, because its energy approaches infinity as its speed tends to 1.
, is always equal to the square of its mass , for all possible
values of its speed . The speed of a massive particle is always less
than 1, because its energy approaches infinity as its speed tends to 1.
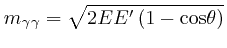
A photon is massless, and its total energy is always equal to the
magnitude
 of its momentum vector , so that
 . If a particle of mass decays into two photons, whose
total energies are and
. If a particle of mass decays into two photons, whose
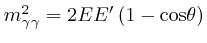
total energies are and  , and whose momentum vectors are and
 , then since
  is equal to the energy of the initial
particle, and
is equal to the energy of the initial
particle, and
 is equal to the momentum vector of the
initial particle, we have:
is equal to the momentum vector of the
initial particle, we have:
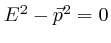
where at the first step in the second line I used
and
 , and at the second step in the second line, I used
 , where
  , which is the
Greek letter theta, is the angle between the directions of motion of the two
photons, and I explained the meaning of
, which is the
Greek letter theta, is the angle between the directions of motion of the two
photons, and I explained the meaning of
 in another
post, here.
in another
post, here.
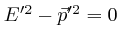
The expression
 is called the invariant mass of the two photons, and from the
above formula, the invariant mass of two photons can be measured by measuring
their energies and , and the angle between their directions
of motion. Photons whose energy is about an MeV or more are often called
gamma rays or
is called the invariant mass of the two photons, and from the
above formula, the invariant mass of two photons can be measured by measuring
their energies and , and the angle between their directions
of motion. Photons whose energy is about an MeV or more are often called
gamma rays or  rays, where the symbol is the Greek letter
gamma, because that is what they were called when they were first observed
about a century ago. So I shall represent the invariant mass of the two
photons by
rays, where the symbol is the Greek letter
gamma, because that is what they were called when they were first observed
about a century ago. So I shall represent the invariant mass of the two
photons by
 .
.
In the Dubna experiment, the candidate E(38) bosons are produced by a beam of
deuterons or protons incident on a copper or carbon target in the JINR
Nuclotron. The candidate E(38) bosons are detected if they are emitted
towards one of the two arms of an electromagnetic lead glass calorimeter
called the PHOTON-2. The left and right arms of the calorimeter are located
3 metres from the target, at angles  to the left of the beam and
 to the right of the beam respectively.
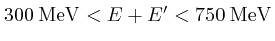
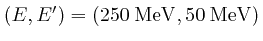
The kinetic energies of the deuterons were 6 GeV = 6000 MeV for the copper
target and 4 GeV = 4000 MeV for the carbon target, and the kinetic energies of
the protons were 4.64 GeV = 4640 MeV for the carbon target. These kinetic
energies are much larger than the 38 MeV mass of the candidate E(38) boson, so
if any E(38) bosons were produced, they would be unlikely to be produced
approximately at rest. Instead they would most likely fly out of the
collision with a kinetic energy somewhat smaller than the kinetic energy of
the incident deuteron or proton, but nevertheless much larger than the 38 MeV
mass of the E(38) boson. The sum of the energies of the two photons the
E(38) boson decayed into would be equal to the total energy of the E(38)
boson, so the energies of both these photons would usually also be much larger
than the mass of the E(38) boson.
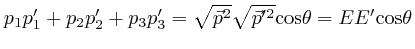
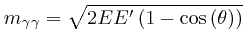
From the above formula, the invariant mass
of a photon of
energy in the left arm of the calorimeter and a photon of energy in
the right arm of the calorimeter would be approximately
 , since
 , so
if and were both much larger than 38 MeV, this would be much larger
than 38 MeV. The invariant mass
of two photons can only
be much smaller than the energies of the photons if the two photons are
travelling in approximately the same direction, so to search for an excess
above the expected background distribution of the invariant mass
of pairs of photons for
in the region of 38 MeV,
the Dubna physicists measured the distribution of
for
pairs of photons in a single arm of the calorimeter, and in the article
arXiv:1208.3829, they report the distributions observed in the right arm of
the calorimeter.
, so
if and were both much larger than 38 MeV, this would be much larger
than 38 MeV. The invariant mass
of two photons can only
be much smaller than the energies of the photons if the two photons are
travelling in approximately the same direction, so to search for an excess
above the expected background distribution of the invariant mass
of pairs of photons for
in the region of 38 MeV,
the Dubna physicists measured the distribution of
for
pairs of photons in a single arm of the calorimeter, and in the article
arXiv:1208.3829, they report the distributions observed in the right arm of
the calorimeter.
To determine whether or not the measured distribution of
contains a signal from a candidate new particle decaying to pairs of photons,
it is necessary to determine and subtract the background distribution of
that results from the particles and interactions of the
Standard Model. As Tommaso pointed out, the most important backgrounds are
bremsstrahlung and the decay of neutral pions. These produce background
distributions of
of completely different character.
Bremsstrahlung, which means "braking radiation," is a smooth random
distribution of photons emitted with a wide range of energies smaller than the
energies of the electrically charged particles involved in a process, that
occurs whenever the speed or direction of motion of a charged particle
changes. A classic result of quantum electrodynamics, discovered by Felix
Bloch and Arnold Nordsieck in 1937, is that for bremsstrahlung photons whose
energies are much smaller than the energies of the electrically charged
particles involved in a process, the energies and directions of motion of the
bremsstrahlung photons emitted randomly in any process are uncorrelated with
each other. This means that the distribution of the energies and directions
of motion of pairs of bremsstrahlung photons, and in particular, their
invariant mass, can be approximately predicted, for fixed experimental
conditions, from observations of the energies and directions of motion of
single bremsstrahlung photons.
The distribution of
from the decay of neutral pions,
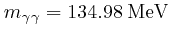
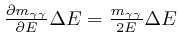
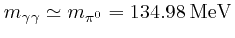
 , is completely different. The
  meson, whose mass is 134.98 MeV, is the lightest strongly-interacting
particle that can be separated by distances of more than about
meson, whose mass is 134.98 MeV, is the lightest strongly-interacting
particle that can be separated by distances of more than about
 from other strongly interacting
particles. Its lifetime is
from other strongly interacting
particles. Its lifetime is
 , where 1 nm = 1 nanometre is
 , and it decays to two
photons 98.8% of the time. Thus the intrinsic quantum-mechanical width of
the meson, which is
, and it decays to two
photons 98.8% of the time. Thus the intrinsic quantum-mechanical width of
the meson, which is  divided by its lifetime, where
 is Planck's constant divided by
 , is
, is
 . So if the energy resolution and angular resolution of
the calorimeter were perfect, so that the invariant mass
of each photon pair was measured without any error, then
the distribution of
from the
decay of mesons, on a plot of
from 0 to 200 MeV,
would look like a sharp spike at
. So if the energy resolution and angular resolution of
the calorimeter were perfect, so that the invariant mass
of each photon pair was measured without any error, then
the distribution of
from the
decay of mesons, on a plot of
from 0 to 200 MeV,
would look like a sharp spike at
 , and 0 elsewhere.
In reality neither the energy resolution nor the angular resolution of
the calorimeter is perfect, so the spike at 134.98 MeV, from decay,
is spread out into a rounded peak.
From page 5 of arXiv:0806.2790, the article which describes the calorimeter
and the way the background was measured, the energy resolution of the
calorimeter is actually
 %, where
is in units of GeV=1000 MeV, and the angular resolution of the calorimeter
is
%, where
is in units of GeV=1000 MeV, and the angular resolution of the calorimeter
is  .
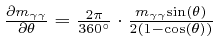
From the formula
.
From the formula
 which we obtained above, and Leibniz's rule for the rate of change of
a product, which I explained in another post, here, and the formula for the
rate of change of
which we obtained above, and Leibniz's rule for the rate of change of
a product, which I explained in another post, here, and the formula for the
rate of change of
 with , when
is measured in radians, which I explained in that post, here, we find
that for in radians:
with , when
is measured in radians, which I explained in that post, here, we find
that for in radians:
where I explained the meaning of an expression such as
 in that post, here. So:
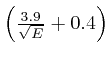
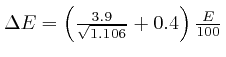
For in degrees rather than radians, the last of these formulae
becomes
 , since
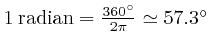 , and the other two formulae are unchanged. These
formulae mean, for example, that if the measurement of is in error by an
amount
, and the other two formulae are unchanged. These
formulae mean, for example, that if the measurement of is in error by an
amount  , where the symbol
  , which is the Greek letter Delta,
is often used to denote a change to the value of the quantity that follows it,
then the corresponding error in the measurement of
will be
approximately
, which is the Greek letter Delta,
is often used to denote a change to the value of the quantity that follows it,
then the corresponding error in the measurement of
will be
approximately
 .
.
The errors in the measurements of
, , and are independent of one another, so the total error in
the measurement of
is on average related to the errors in
the measurements of , , and by Pythagoras's rule:
for in degrees.
The observed photon pairs with a given value of
 can have a range of different values of , , and
, and for a representative example with
can have a range of different values of , , and
, and for a representative example with
 , I'll take
  , and
, and
 , which from pages 3 to 5 of arXiv:0806.2790 is
approximately the angle between the paths of a photon that passes through the
center of the right arm of the calorimeter, and a photon that passes through
the edge of the front surface of the right arm of the calorimeter. Then from
, which from pages 3 to 5 of arXiv:0806.2790 is
approximately the angle between the paths of a photon that passes through the
center of the right arm of the calorimeter, and a photon that passes through
the edge of the front surface of the right arm of the calorimeter. Then from
 , we have
 . For this value of , the
formula above for the energy resolution of the calorimeter gives
. For this value of , the
formula above for the energy resolution of the calorimeter gives
 , so
, so
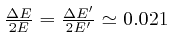 . And for
 , from the angular resolution of the calorimeter, as above, we
have
, from the angular resolution of the calorimeter, as above, we
have
 .
.
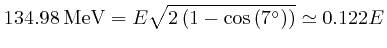
Thus for this example we have
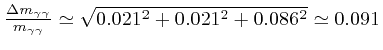 , so
the measured distribution of
is expected to show the spike at 134.98 MeV, from
decay, spread out into a peak of half-width about
, so
the measured distribution of
is expected to show the spike at 134.98 MeV, from
decay, spread out into a peak of half-width about
 , and this is in approximate
agreement with the peak seen with a deuterium beam incident on a
carbon target in Figure 8 of the article arXiv:1208.3829 announcing the
observation of the E(38) boson, although a high bin in the corresponding
measurement for a deuterium beam incident on a copper target, in Figure 9 on
page 13 of the article, spreads the peak a little further in that
case. These observations of the peak serve to calibrate the mass
measurement.
, and this is in approximate
agreement with the peak seen with a deuterium beam incident on a
carbon target in Figure 8 of the article arXiv:1208.3829 announcing the
observation of the E(38) boson, although a high bin in the corresponding
measurement for a deuterium beam incident on a copper target, in Figure 9 on
page 13 of the article, spreads the peak a little further in that
case. These observations of the peak serve to calibrate the mass
measurement.
From pages 8 and 15 of arXiv:1208.3829, the Dubna group used a method called
"event mixing" to measure the shape of the background distribution of
. From the description on page 5 of arXiv:0806.2790, this
means that each pair of background photons consists of two observed photons
randomly selected from different events. From the result of Bloch and
Nordsieck that I mentioned above, this would give the exact shape of the
background distribution of
if the background was purely
bremsstrahlung, provided the photon energies were low enough, and the mean
number of bremsstrahlung photons of sufficient energy to trigger the
calorimeter was the same for all relevent motions of the electrically charged
particles involved, because the Bloch-Nordsieck result, that the energies and
directions of motion of the bremsstrahlung photons are uncorrelated with each
other, becomes exact in the limit where the photon energies tend to 0, because
the emission of a photon then has negligible effect on the energy and momentum
of the charged particle that emitted it.
In reality, the relevant photon energies are around 10% of the kinetic
energies of the deuterons or protons in the beam incident on the target, so
the Bloch-Nordsieck result applies approximately but not exactly. This means
that the event mixing method of measuring the background introduces systematic
errors due to the violation of the energy and momentum conservation laws, when
the two-photon background is measured by randomly selecting pairs of single
photons from different events. We would also expect systematic errors to be
introduced due to contamination of the single photon bremsstrahlung background
by photons from decay, unless the background is measured by randomly
combining pairs of single photons from events that contain exactly
one photon. This is not possible in practice, however, since the
calorimeters only cover a small fraction of the solid angle around the
interaction point. The paper arXiv:1208.3829 announcing the observation of
the E(38) boson does not discuss this source of systematic error.
Figure 11 of the article arXiv:1208.3829 announcing the observation of the
E(38) boson, which I am reproducing here
 with permission, shows the comparison
of the event mixing background with the distribution of
for about
with permission, shows the comparison
of the event mixing background with the distribution of
for about  simulated events for the deuteron beam incident on the copper
target. This provides evidence that the event mixing method adequately
represents the two-photon background over the relevant range of
from about 10 MeV to about 90 MeV, so that contamination of the
background by photons from decay is not significant for this range of
. Comparison with Figure 2(a) of the article, which I
reproduced above, shows that the excess centred at about 38 MeV in the
measured data is absent from the simulation based on the Standard Model shown
in Figure 11.
simulated events for the deuteron beam incident on the copper
target. This provides evidence that the event mixing method adequately
represents the two-photon background over the relevant range of
from about 10 MeV to about 90 MeV, so that contamination of the
background by photons from decay is not significant for this range of
. Comparison with Figure 2(a) of the article, which I
reproduced above, shows that the excess centred at about 38 MeV in the
measured data is absent from the simulation based on the Standard Model shown
in Figure 11.
To try to reduce systematic errors, while at the same time improving the
signal to background ratio for any genuine signal there might be, by reducing
the background without significantly reducing any genuine signal, limits
called "cuts" are imposed on the energies of the photons and on the angle
between pairs of photons, in order for a pair of photons to be counted in the
reported data. So the data that the experiment actually reports is the
distribution, or the set of number counts, of photon pairs observed in the
right-hand calorimeter, that satisfy the specified cuts. The range of
relevant values of
, which is from about 10 MeV to about 80
MeV for the search runs, is divided into intervals of 2 MeV, and the
experiment reports the number of photon pairs that satisfy the specified cuts,
for
in each of about 35 intervals of 2 MeV. (For the
calibration runs, where the peak rather than a possible new boson at
38 MeV was the target of the observations, the observations covered the range
of
from about 60 MeV to about 250 MeV, and this range was
divided into intervals of 10 MeV.)
The cuts have to be applied in exactly the same way to the observed data and
to the measured or modelled background. So for the event mixing method of
measuring the background that the Dubna group used, each pair of background
photons, which comprises two photons randomly selected from different events,
is accepted or rejected according to the specified cuts on the energies of the
photons and the angle between their directions of motion, exactly as if the
two photons were from the same event.
As Tommaso
pointed out, the necessity of applying selection cuts to the data
means there is a danger that physicists eager to discover a new particle
might "tune the cuts", so as to create the appearance of a signal of a
new
particle, where in reality there is none. If the modelling of the
background
was perfect, and the number of events observed was sufficiently large
that the
impact of random statistical fluctuations was negligible, then this
would be
impossible. But for real experiments, it is necessary to guard against
the
problem of tuning the cuts.
One method that is often used to avoid the danger of tuning the cuts is to
analyse the data "blind": the physicists fix the choice of selection cuts,
and measure or model the background, before they allow themselves to look at
the actual measured data. However this method leaves open the possibility
that the cuts might accidentally be tuned by chance, so that the cuts amplify
the effect of a statistical fluctuation, which could lead the experiment to
report an erroneous result.
A more robust and informative way to avoid the danger of tuning the cuts is to
investigate and report the effect of a range of different cuts. This is the
approach used by the Dubna group in the paper arXiv:1208.3829 that announces
the observation of the E(38) boson. They consider 4 different choices of
cuts, which fall, however, into 2 pairs of similar choices, and for the
deuteron beam on a copper target, where the kinetic energy of each deuteron is
6 GeV = 6000 MeV, they report the measurements for all 4 choices of the cuts.
To get a rough understanding of the background distribution of
that results from a particular choice of cuts, I'll consider their
criteria (A), which are the criteria used for the measurements shown in Figure
2(a), which I reproduced above, and for the simulation shown in Figure 11,
which I reproduced above. The cuts in this case are that the energies
and of the two photons are required to be
 , where the symbol
  means
"greater than"; the sum of the photon energies is required to
satisfy
means
"greater than"; the sum of the photon energies is required to
satisfy
 , where the symbol
  means "less
than"; and the angle between the directions of motion of the two
photons is required to satisfy
means "less
than"; and the angle between the directions of motion of the two
photons is required to satisfy
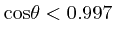 , which means
that is required to be not less than about
, which means
that is required to be not less than about  . Tommaso
suggested that the purpose of the lower limit on might be to ensure
that the two photons are in most cases found in different modules of the
calorimeter.
. Tommaso
suggested that the purpose of the lower limit on might be to ensure
that the two photons are in most cases found in different modules of the
calorimeter.
From the diagram on page 1 of the announcement paper arXiv:1208.3829, which
also appears on page 4 of the paper arXiv:0806.2790 which describes the
detector and the method of measuring the background, each of the two arms of
the calorimeter consists of 16 hexagonal modules. From the table on page 5
of arXiv:0806.2790, the total area of the two arms of the detector is
 , so the area of one arm of
the detector is
, so the area of one arm of
the detector is
 . To
get a rough understanding of the background distribution of
, I'll approximate the right arm of the detector as a circle of this
area. I'll denote the radius of that circle by
. To
get a rough understanding of the background distribution of
, I'll approximate the right arm of the detector as a circle of this
area. I'll denote the radius of that circle by  , so from
 , we have
 , where the symbol
  means
"approximately equal to".
means
"approximately equal to".
From page 3 of arXiv:0806.2790, the front surface of the calorimeter is 3
metres from the interaction point, so if one photon passes through the centre
of the calorimeter and the other photon passes through a point on the edge of
its front surface, then we have
 , so
, so
 and
and
 , while if the two photons pass through opposite points on the edge
of the front surface of the calorimeter, we have
, while if the two photons pass through opposite points on the edge
of the front surface of the calorimeter, we have
 and
and
 .
.
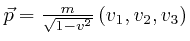
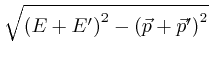
From above, the invariant mass
of the two photons is
 . For fixed energies and of the photons, the largest possible value of
is obtained when
has its minimum
value of about 0.970, so the largest possible value of
is
about
. For fixed energies and of the photons, the largest possible value of
is obtained when
has its minimum
value of about 0.970, so the largest possible value of
is
about
 , and the smallest possible value of
is obtained when
has the maximum value 0.997
allowed by the cut, so the smallest possible value of
is
about
, and the smallest possible value of
is obtained when
has the maximum value 0.997
allowed by the cut, so the smallest possible value of
is
about
 .
.
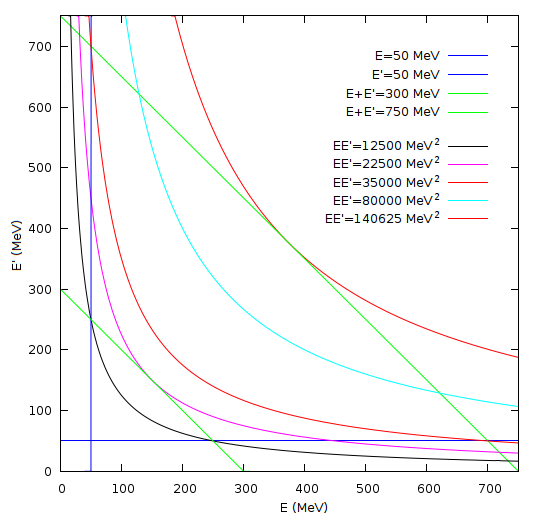
This diagram shows the cuts on and for the criteria (A), with
plotted in the horizontal direction and plotted in the vertical
direction. The allowed values of
 lie within the
trapezium-shaped region whose boundaries are the green straight line running
from the top left corner to the bottom right corner of the diagram, which
corresponds to
lie within the
trapezium-shaped region whose boundaries are the green straight line running
from the top left corner to the bottom right corner of the diagram, which
corresponds to
 , the
green straight line parallel to that one, which corresponds to
, the
green straight line parallel to that one, which corresponds to
 , the vertical blue straight line,
which corresponds to
, the vertical blue straight line,
which corresponds to
 , and
the horizontal blue straight line, which corresponds to
, and
the horizontal blue straight line, which corresponds to
 . The five curved lines are
examples of lines on which the product
. The five curved lines are
examples of lines on which the product  has a constant value. The
smallest value of attainable in the trapezium-shaped region of allowed
values of
corresponds to the black curve,
has a constant value. The
smallest value of attainable in the trapezium-shaped region of allowed
values of
corresponds to the black curve,
 , which intersects the allowed
region at the points
, which intersects the allowed
region at the points
 and
and
 . So the smallest possible
value of
for the cut criteria (A) is about
. So the smallest possible
value of
for the cut criteria (A) is about
 , which is roughly in agreement with
Figures 2(a) and 11, that I reproduced above and above. The largest attainable value
of corresponds to the upper red curve,
, which is roughly in agreement with
Figures 2(a) and 11, that I reproduced above and above. The largest attainable value
of corresponds to the upper red curve,
 , so the largest possible
value of
for the cut criteria (A) is about
, so the largest possible
value of
for the cut criteria (A) is about
 , which is again roughly in agreement
with Figures 2(a) and 11.
, which is again roughly in agreement
with Figures 2(a) and 11.
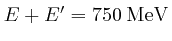
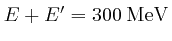
As Tommaso pointed out, it is also important to understand the normalization
of the background distribution, which is the overall scale factor applied to
the background distribution once its shape is known. To address this
requirement, the Dubna physicists used two different normalizations of the
background distribution for each set of cut criteria. The first choice of
background normalization, used in Figures 2(a), 3(a), 4(a), 5(a), 6(a), 7(a),
and 10(a), set the total number of background photon pairs equal to the total
number of observed photon pairs, which due to the excesses above background in
the region of
 , resulted in the observed
distribution of photon pairs falling below the background for some intervals
of
. The second choice of background normalization, used
in Figures 2(b), 3(b), 4(b), 5(b), 6(b), 7(b), and 10(b), set the number of
background photon pairs in a range of
away from the excess
around
equal to the number of observed photon pairs in that range of
. This method of fixing the background normalization in a "control
region", away from the candidate "signal region", is often used in searches
for new physics at the CERN Large Hadron Collider. The announcement paper
arXiv:1208.3829 found evidence for the E(38) boson for all the processes,
choices of cut criteria, and choices of background normalization for which it
presented measured data.
, resulted in the observed
distribution of photon pairs falling below the background for some intervals
of
. The second choice of background normalization, used
in Figures 2(b), 3(b), 4(b), 5(b), 6(b), 7(b), and 10(b), set the number of
background photon pairs in a range of
away from the excess
around
equal to the number of observed photon pairs in that range of
. This method of fixing the background normalization in a "control
region", away from the candidate "signal region", is often used in searches
for new physics at the CERN Large Hadron Collider. The announcement paper
arXiv:1208.3829 found evidence for the E(38) boson for all the processes,
choices of cut criteria, and choices of background normalization for which it
presented measured data.
By using well-known properties of bremsstrahlung, I used the Dubna
measurements to estimate the coupling constant of the up and down quarks to
the E(38) boson candidate as roughly  in order of magnitude, if the
E(38) is produced in a bremsstrahlung-like manner and decays only to two
photons. The details are here.
For comparison, the coupling constants of electrons, up quarks, and
down quarks to photons, in the same units, are about
in order of magnitude, if the
E(38) is produced in a bremsstrahlung-like manner and decays only to two
photons. The details are here.
For comparison, the coupling constants of electrons, up quarks, and
down quarks to photons, in the same units, are about  ,
,  , and
, and  respectively. The small magnitude of the coupling constant of the up
and down quarks to the E(38), and the presumed equally small or smaller
coupling constant of electrons to the E(38), would explain why the existence
of the E(38) was not suspected until it was proposed last year by Eef van
Beveren and George Rupp in arXiv:1102.1863. The coupling constant of the up
and down quarks to the E(38) could be substantially larger in magnitude than
if, for example, the E(38) decayed mainly to pairs of sufficiently
light particles of dark matter, so that only a small fraction of the E(38)'s
produced in the Dubna experiment decayed to pairs of photons.
respectively. The small magnitude of the coupling constant of the up
and down quarks to the E(38), and the presumed equally small or smaller
coupling constant of electrons to the E(38), would explain why the existence
of the E(38) was not suspected until it was proposed last year by Eef van
Beveren and George Rupp in arXiv:1102.1863. The coupling constant of the up
and down quarks to the E(38) could be substantially larger in magnitude than
if, for example, the E(38) decayed mainly to pairs of sufficiently
light particles of dark matter, so that only a small fraction of the E(38)'s
produced in the Dubna experiment decayed to pairs of photons.
The up and down quarks are the main quark constituents of protons and neutrons: a
proton consists of two up quarks plus a down quark plus an indeterminate
number of quark-antiquark pairs and gluons, and a neutron consists of an up
quark plus two down quarks plus an indeterminate number of quark-antiquark
pairs and gluons.
Quarks are similar to electrons, except for the fact that they can emit
and absorb gluons. Gluons are similar to photons, except for the fact
that they can themselves emit and absorb other gluons. The quarks and
gluons interact so strongly with each other that an isolated quark or
gluon can never be separated from other quarks or antiquarks and gluons
by a distance of more than about 10-15 metres.
Quarks and gluons can be indirectly "seen" in high energy physics
experiments such as the ATLAS and CMS experiments at the Large Hadron
Collider at CERN, because a near head-on collision between a quark,
antiquark, or gluon in a proton going in one direction around the
accelerator ring and a quark, antiquark, or gluon in a proton going in
the other direction around the accelerator ring results in those quarks,
antiquarks, or gluons flying out of the protons that contained them, in
directions that can be up to 90° from the beam direction. As they fly
out of the proton that contained them, these quarks, antiquarks, or
gluons rapidly emit more quarks, antiquarks, and gluons, in a process
similar to bremsstrahlung, and these emitted quarks, antiquarks, and
gluons in turn emit more, so that a cascade of emitted quarks,
antiquarks, and gluons builds up. The quarks, antiquarks, and gluons in
such a cascade rapidly assemble themselves into particles such as pions,
protons, and neutrons, which are seen in the detector as a "jet" of
particles of this type, whose total energy and momentum match the energy
and momentum of the quark, antiquark, or gluon that the jet originated
from.
The software on this website is licensed for use under the
Free Software Foundation
General Public
License.
Page last updated 30 November 2020.
Copyright (c) Chris Austin 2012 - 2020.
Privacy policy